
Intro to Multi-Tenancy in Sigma
February 1, 2026
We built an AI App in Sigma to automate SEO blog content generation. Here’s how we did it
February 8, 2026Sigma AI App workflow design patterns: a Weekly Update case study
TL;DR
For all the folks my age, TLDR is young kids speak for “cutting to the chase.” At Maverick Data, our clients receive weekly updates on the status of their project, budget, blockers, and weekly accomplishments. This used to be a manual exercise in Google Slides. We took that manual process and rebuilt it as a one-screen app in Sigma using input tables, AI summarization, and models mimicking our old template.
The result is a significantly more automated process, increased accuracy, and a weekly time savings of about 30 minutes per consultant per client. This post isn’t about implementation details, it’s an idea kit for shifting from manual workflows to data-driven workflows built with Sigma AI Apps. Steal the patterns and apply them anywhere.
Why I am writing this
It’s another Friday afternoon wrapping up another week of client work and I have one last thing to do before the weekend – the weekly status update. One tab is open to grab one number. Another tab for another. An Excel spreadsheet to bring it all together and make calculations. Notes scattered. Paste results into a slide. Screenshot. Email. Tell yourself you will do it earlier next Friday so you can get your weekend started off on a better note. Next Friday arrives. Same dance. Same manual process.
Sigma AI Apps enter the chat.
Instead of a manual process of copying and pasting numbers from source to slide, use the following:
- Controls that users change to set the scope of the update
- Input tables that enable user edits with validation
- Actions that choreograph the update steps
- Modals that keep the page from getting cluttered
- AI functions that handle condensing and summarizing of daily task notes
Click, check, send.
You can see an example of our weekly status update, below.

Below are the patterns that matter. Steal them.
Pattern 1: Controls as app state, not just filters
We use three single-select controls – Client, Project, and Week – to drive the entire update and workflow. If a control is empty, placeholders are shown. If they are set, the elements on the page are rendered. Treat the controls like parameters your app uses everywhere and let actions set control values for you.

An extra nifty trick is to use actions to auto-select values in other list value controls. When a Client Name is selected, actions automatically set the Project Name to the first project and the Week to the most recent week that billing entries exist. It makes an assumption that the Weekly Update the user wants to work on is the current week, while give flexibility to go back and look at previous week’s updates. Is it a huge timesaver? No. Does it have a lot of impact in the convenience, presentation, and wow factor? Big time.
Pattern 2: A “Project Overview” for the most critical numbers
This section is all about displaying the most important numbers at a glance and it’s also where the bulk of the mistakes happen when you’re hand-jamming the numbers in Excel. KPI charts are particularly good for this application, but for space and customization reasons, I went with a container with textboxes. Textboxes allow you to enter a custom formula against the data in your workbook – just press “=” to get started.

Pattern 3: Status indicators controlled with a modal
While simple visually, the Project Status indicators have a few different moving parts to make them work:
- Single column/row pivot tables for each indicator driven from a one row input table
- Another input table that stores the Red/Yellow/Green value for each indicator stored at the Client/Project grain
- A modal popup with list value controls that are set behind the scenes when a Project is chosen (there’s an action set on the Project list values control to go retrieve the set values from the input table – if no value is set, the default color is green).
This design pattern persists the current project status for the entirety of the project and makes updates just a couple of button clicks.

Pattern 4: Modals for the details a human needs to add
Sometimes you just can’t automate everything, but you can persist the things that matter so you don’t have to enter them over and over again. In the Weekly Update, there are placeholders for In Progress and Upcoming items:
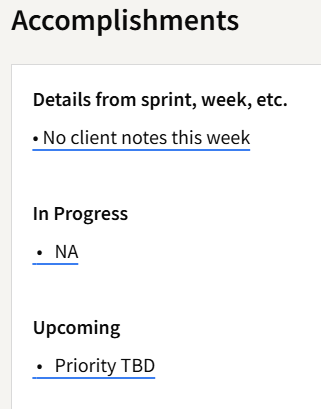
This entire section is just a single textbox inside a container. You can mix both hard-coded text and Sigma formulas. In the image above, the screenshot was taken in edit mode so you can see where there is explicitly defined text and where formulas are used (the blue underlines). This allows you to apply formatting to your text while letting the values still be data driven and dynamic.
We will talk about the Details from sprint, week, etc. later, but to add items to the In Progress and Upcoming sections, I used a button that opens a modal:
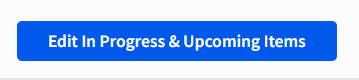
An Open Modal action on the button then opens this modal:
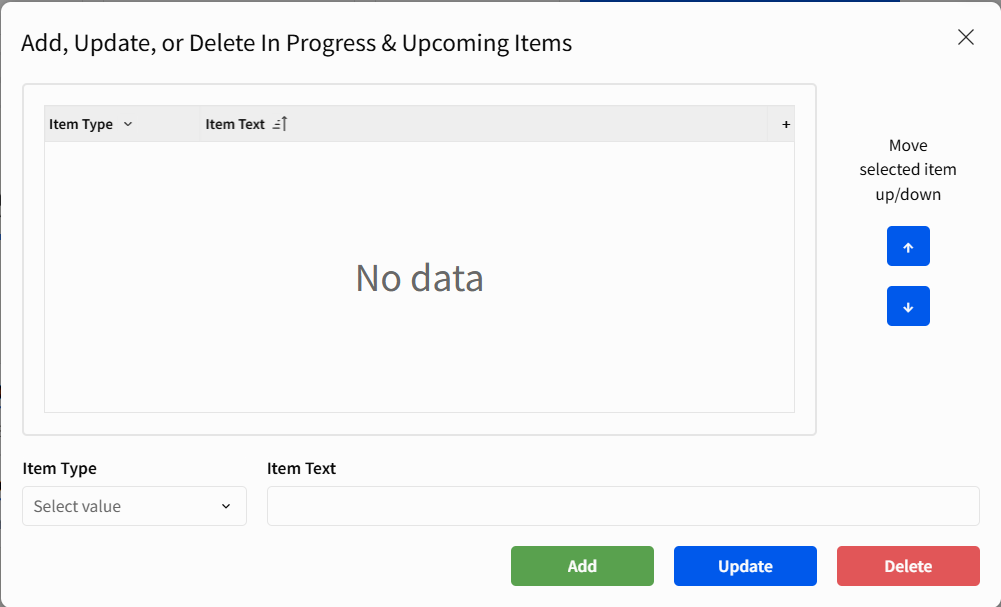
This modal contains an entire CRUD (create, read, update, delete) sequence for managing these items. Sigma makes this easy using insert, update, and delete actions that are triggered by each corresponding button control and performs the necessary operation on the underlying Input Table:

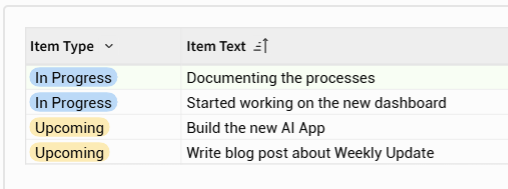
These items now render in the textbox as bulleted items:

A piece of bonus functionality that I added just for fun is the ability to sort the items in the list. This is enabled by using a sort order column: every time a new item is entered in the list, the sort order increments by one based on the largest value in the column to ensure uniqueness.
Clicking on a row is an action that can be performed on a table element in Sigma. When the user clicks a row, behind the scenes, I am setting text input controls with the following values: the current row ID and sort order, the preceding row ID and sort order, and the next row ID and sort order. When the user clicks the up or down button, an action updates two rows: the current selected row and either the previous or next row (depending on the button) and “swaps” the sort order. The table needs to be sorted by the sort order column and voila, the display order has been changed:

One side note: I used a similar pattern for the Risks & Blockers section (which I won’t cover here for brevity’s sake), but I didn’t need to use a button to open the CRUD modal. Why? Because a table element has actions and a textbox does not.
Pattern 5: Use AI to auto-summarize text
This part was the most rewarding of the build because it almost looks like magic. Once the Client, Project, and Week are selected, an AggText function with AI_AGG is executed in the background that inserts all the notes from the billing entries for the week into the prompt and the output is a handful of summarized bullets a few seconds later:


Closing
Modern BI is not about simply building charts and graphs. It is about leveraging AI Apps and platforms that work the way YOU work – not the other way around. Hopefully this blog and use case has given you some design patterns and useful methods of approaching the automation of workflows – something an Excel workbook and Google Slide can’t replicate. Next time you’re building a new workflow, remember some of these patterns and neat tricks that make Sigma uniquely impactful.
Contact Us
If you would like to talk to someone at Maverick Data about maximizing your usage of the Sigma platform, please email us at spencer@maverickdata.io for more information!